![]()
Common Ground OR-WA
Original Research
Financing TOD in Portland’s Light Rail Corridors: A Comparison of two Value Capture Mechanisms
Tom Gihring, Ph.D.
Research Director of Common Ground OR-WA
May 2020
Executive Summary:
Common Ground OR-WA has been promoting a unique form of value capture known as Transit Benefit Districts. A TBD is a district circumscribing a transit station area designed to capture annual land value gains that are attributed to public investments in transit. Rail transit not only creates accessibility benefits to transit riders but also creates value for the owners of nearby properties in the form of higher site values. TBD is fairer than other taxing mechanisms because it captures only the unearned increment of value given to private property. Still, some are suggesting that Prosper Portland could use the same urban renewal area model in the Southwest Corridor that it has used around the city. Tax increment financing for URAs is a diversion of the growth in property values from other taxing districts.
This study concludes that the TBD approach is not only fairer to district landowners and all city taxpayers but is also a more robust tool than urban renewal for generating revenue to fund infrastructure and affordable housing in transit-oriented development (TOD) areas. To illustrate this case, we take an existing TOD in Seattle and apply Oregon’s tax structure to simulate the capture of annual property values, comparing results using the TBD and TIF methods. Simulation modeling reveals the total land value premium capturable within a TBD over a 15-year project period to be $1,965 million – the sum of annual betterment levies. The TIF scheme captures only 1.5 percent of the amount captured from land rents using the TBD method. TIF levies are much less, largely because of the effects of using lower maximum assessed values (MAV) in the base year and limiting the growth in assessments to 3 percent annually. TBD levies are based on real market values (RMV) which in this case are three times as high at base year. Common Ground OR-WA recommends the creation of a pilot TBD in Southwest Corridor.
Defining Genuine Value Capture
The term ‘value capture’ has been loosely used to cover almost every form of special tax acquiring gain in property values. Methods vary – from compulsory capture through levies, to voluntary capture through partnership agreements between property owners and a local authority. Two strategies are commonly used in Oregon:
Special Assessment – a tax assessed on parcels identified as receiving a direct and unique benefit as a result of a public project. The Local Improvement District (LID) has been used to finance capital improvements in transportation infrastructure such as Portland Streetcar.
Tax Increment Financing – a special provision in state law that allows the diversion of annual property tax increments derived from the increase in property values over a base year to a fund used to pay off capital bonds for public improvements within a TIF district. Urban renewal districts have been widely used in Portland to fund both neighborhood community improvements and light rail transit.
Common Ground OR-WA has been promoting a form of value capture known as Transit Benefit Districts. A TBD is a district circumscribing a transit station area designed to capture annual land value gains that are attributed to public investments in transit. It is based on the proposition that new transportation improvements such as a rail station not only create accessibility benefits to potential transit riders but also create value for the owners of nearby properties in the form of higher site values and new development opportunities. Land-based taxing mechanisms are rooted in the benefits principle, whereby financial benefits are in effect capitalized into land values, or ‘land rent’.
Revenue raised from the assessment of property owners in a TBD is to be used for public works projects that support planned transit-oriented development (TOD). Place-making improvements include right-of-way improvements, the enhancement of street connectivity and feeder transit connections, bicycle & pedestrian amenities, public art, parks, and plazas. Revenue may also be used for gap financing of the development of below-market rate housing within the TBD. No authorization would be given to collect revenues for the construction of transit infrastructure or for operating expenses.
The capture of incremental land values produces two socially desirable effects: (i) reducing the temptation for landowners to speculate on sites and keep them out of productive use whilst waiting for land value gains to accrue, and (ii) raising the holding costs to a level at which owners will rather seek a better return on their property investment by reinvesting in building improvements.
A TBD is like a local improvement district (LID), whereby a contiguous group of property owners share in the cost of installing new infrastructure by paying in direct proportion to benefits derived from the improvements. But unlike a LID which is capital cost-driven, the TBD approach is market-driven. The practice is to capture only the incremental increase in land values beyond the growth levels that have been generally occurring without the transit improvements – that is, the uplift attributed to transit station location. Capturing land value uplift or ‘betterment’ is a quid pro quo.
TBD betterment assessments are levied annually on whatever level of uplift occurs in that year. In low-performing districts TOD may take several years for the market to mature. In this instance planned TOD improvements would be prioritized by a local planning agency and installed as levy funds become available. In high performing districts bond financing might be the better choice over pay-as-you go.
A major distinction should also be drawn between the TBD approach and tax increment financing. TIF is a manipulation of the general property tax, whereas a betterment levy is a separate tax, not unlike a mandatory LID. Some observers may erroneously believe that TIF is a tool of land value return. But in fact, it transfers value from one area to another rather than returning additional value to the public sector. With TBDs, regular taxing districts such as school districts are not deprived of the increases in property tax revenue they need to meet increased demand for services by new households and businesses.
Both TIF and LID are structured to capture both land values and building values. Improvement value is the component of property assessments attributable to private capital investment on individual parcels. Liberal economic principle holds that owners have the intrinsic right to retain the building value which they themselves have created. A tax on land values produces economic and social consequences vastly different from a tax on improvements. Hence, the TBD approach is the only ‘pure’ form of value capture available that captures solely the value component that is unearned by property owners – land rent.
Simulating Value Capture
The purpose of this exercise is to compare two methods of capturing property values within light rail station areas identified for transit-oriented development: urban renewal using TIF and land value capture using TBD.
The ECONorthwest White Paper 3: Implementation Strategies for the Southwest Corridor transit project (Jan. 2018) suggested that Prosper Portland could use the same urban renewal area model that it has used around the City of Portland. If this model were used and a new URA were formed in the Southwest Corridor a required minimum of 45 percent of all tax increment would be set-aside specifically for affordable housing. Prosper Portland has undertaken a preliminary financial analysis to understand the revenue potential of a new URA, but a complete survey of parcel land values, additional planning work, and community engagement would be necessary to advance this concept and create a new URA.
Preliminary research conducted by Common Ground OR-WA supports the view that the TBD approach is not only fairer to district landowners and all city taxpayers but that is also a more robust tool than URAs for producing revenue. To illustrate this case, we take an existing TOD in Seattle and apply Oregon’s tax structure to simulate the capture of annual property values comparing results using the TBD and TIF methods. The original Seattle value capture study was conducted in 1997; this model will carry forward the district’s property assessments in order to simulate a present-day TBD project.
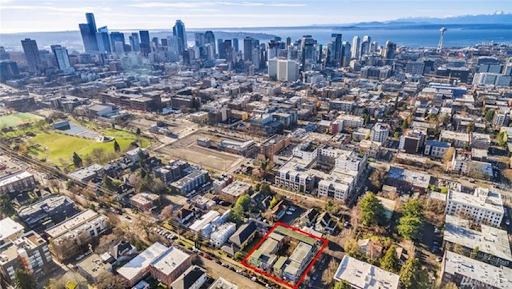
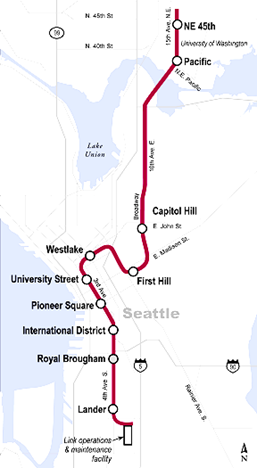
Seattle’s Capitol Hill business district offers an opportunity for a case study of value capture within a hypothetical TBD or URA surrounding the planned rail station. The Broadway-John Street LRT station is the first stop on the northbound University LINK Extension. There are 458 taxable parcels within a quarter-mile radius of the station (see Figure 1). We want to know what amount is capturable from all parcels within this circumscribed area. This requires a dynamic model containing estimates of land value growth rates, zoned development capacity within the district, and the redevelopment potential of parcels.
Figure 1
HB1490 of Washington’s Growth Management Act specified that land for new transit-oriented development must be designated at densities that support transit services. The model assumes the overall average net density within the TBD at the build-out year will reach Seattle’s standard 50 dwelling units per net acre.
The 458 station area properties are classified into redevelopable and non-redevelopable subsets, corresponding to their current (1996) utilization status – underutilized and fully-utilized. The criteria used to indicate underutilized status is a high ratio of land value to total value (LTV > .66) and a lower than average floor area ratio (FAR). Using these criteria, the model assumes the 157 parcels identified as underutilized and redevelopable will be rebuilt within the project period of 15 years; it assumes the fully utilized parcel subset will not be converted or substantially improved.
New rebuilds on the 157 redevelopable sites will have to average about 3.4 FAR to reach the target density. The total amount of new building space on these redeveloped sites yields over 456,000 sq. ft. of rentable retail space and over 1,800 dwelling units. For modeling purposes, all new construction is mixed-use residential/ground floor retail. We shall first consider the TBD approach to value capture.
The first step in simulating value capture effects is to project land value growth over a period during which the anticipated rebuilding activity within the TBD will be completed. Fortunately, a recent study of property value premiums in Seattle’s LINK light rail station areas sponsored by the American Public Transit Association and National Association of Realtors (Oct. 2019) provides the longitudinal data useful for projecting land value growth rates during the TBD project period. The study found that median home sales prices in station areas on the LINK light rail line grew by 55 percent, and commercial property prices grew by 149 percent from 2012 over a 5-year period, coinciding with Capitol Hill station construction leading to opening in 2016. We can assume that price increase is subsumed in land values.
Combining the two findings we calculate a weighted annual increase rate of 15 percent, considering the proportional distribution of residential and commercial land uses within the total TBD parcel count. This compares with a historic nine percent average annual land value growth rate found on representative properties in the Broadway-John business district from 1996 to 2009. Both growth rates are carried forward to 2017 – the date the model adopts for the start of the TBD project period. The 15 percent figure is the ‘rapid growth rate’ and the 9 percent figure is the ‘trend rate’. The general practice when conducting feasibility studies is to use one or two options for measuring projected rates: (i) land values before/after the transit station location is announced, or (ii) land values inside/outside of the circumscribed assessment district.
Estimated building value (BV) rates of increase is also needed in this model because a simulated URA district using the TIF method will appropriate both land and building values from the regular property tax. To project trend BVs, we utilize the annual CPI Index from 1997 to 2017, the average of which is 2.49 percent. Historically, assessed building values in Washington and Oregon increase beyond the rate of inflation, maintaining a fairly steady proportion to land value. Hence, we normalize the annual values by raising the CPI to a level where the target land-to-total value ratio matches the existing LTV ratio of land use classes within the TBD. This brings the overall BV trend rate to 5.89 percent.
To estimate BVs over the TBD project period we factor in new construction on the 157 redevelopable parcels accounting for inflation. If private construction activity follows as projected, the value of new buildings on redevelopable sites will grow at an average rate of 25.6 percent per year over the 15-year rapid growth period 2017 – 2032. This rate is based on the build-out FAR of 3.4 and the unit building value of typical new construction sites in Seattle’s urban centers which is estimated at about $178 per sq. ft. of floor area in 2017 dollars. Annual building value growth of the remaining fully developed parcels is 2.49 percent, the annual inflation rate including the normalized building values of that subset. See Table 1 for model input assumptions and parameters.

Model Dynamics
The TBD simulation period begins in 2017 and continues for a project period of 15 years. Arising from the trend growth in assessments, the combined real market value (RMV) land + building value in the 2017 base year has increased to $956 million; the land value $437 million and the building value $519 million (see Table 2). The land value premium or uplift derives from the difference between the trend growth rate of 9 percent annually and the rapid growth rate estimated at 15 percent. The combined rapid growth rate including land and building values is 11.64 percent.
Since 1995 Oregon has been saddled by the ill-conceived Measure-50 tax limitation that caps annual growth in property assessments to three percent. Over the years taxable assessments have lagged far behind true market values, especially in rapid value growth neighborhoods. Oregon is not the only state experiencing this lag. In some states like Delaware and New York, counties have not revalued properties in several years. Furthermore, U.S. assessors have tended to undervalue land relative to improvements in order to avoid taxpayer complaints and lawsuits. In any jurisdiction shifting to a two-rate property tax, both components need to be measured timely and accurately.
The simulation model applies the Oregon tax regime to Seattle’s Broadway-John St. station area. Backing up to the start of M-50 limitations in 1997, the total real market assessment would have been $165 million. Projected at 3 percent per year, the maximum assessed value (MAV) on all 458 taxable parcels at the 2017 base year is $317 million, only one third of RMV ($956 million). During the TBD project period whilst the assessment gap continues to increase, the overall MAV/RMV ratio reaches to only 16 percent. The Multnomah County effective tax rate (mill rate) on MAV assessments in tax year 2017-18 is $22.82 per thousand AV. Accounting for the county-wide MAV/RMV ratio in that year, the RMV tax rate would have to be lowered to $22.82 to achieve revenue neutrality.

Model Results
The first step in the simulation model employs the transit benefit district approach to value capture, comparing land values over the TBD project period at the rapid growth rate with land value growth at the trend rate. The difference is the land value premium capturable by annual TBD betterment levies. By year 16 land values have grown at the rapid rate to $3,558 million compared to the trend growth to $1,593 million. Land values captured in TBDs are always real market value.
The sum of annual land rent capturable over all 15 years at the rapid rate is $3,120 million; at the trend rate the total land rent is $1,155. We measure total land rent as the annual growth in land value from one year to the next, summed over the project period. The difference is $1,965 million – the sum of annual betterment levies (see Table 3).
Putting aside the betterment capture method for a moment, it could be useful to look at a hypothetical situation where regular property tax levies based on RMV and MAV assessments are compared. The base year RMV tax levy is $9.8 million, growing to $51 million in the final year, and totaling $387 million over 15 years. The MAV levy in year 1 is $7.2 million, growing to $11 million in year 16, and totaling $138 million over the project period. The M-50 imposed 3% annual growth limit on MAV assessments results in a diminishing MAV/RMV ratio, from .33 to .10, and the total MAV levy amounts to only 36% of the RMV levy. This is a first indication that tax levies on lower than market assessments are seriously diminished.

Finally, we shall consider how urban renewal using TIF compares to land value capture using the TBD method. Portland City Council has stated its commitment to avoiding mistakes associated with prior URAs and light rail line investments. Previously, TIF revenues were largely dedicated to the capital costs of the light rail line itself, rather than to other important plan elements such as housing affordability. As a result, the inducement was to enlarge UR districts to capture tax increments sufficient to cover the high costs of rail transit infrastructure.
Presently the inclination towards large districts has abated, as opposition from property owners in the vicinity of transit corridors as well as from regular taxing districts has grown. We shall assume that for the purpose of this analysis, Prosper Portland will limit the boundaries of URAs to station areas designated for TOD. The boundaries of the TIF district coincide with the Capitol Hill TBD as previously described.
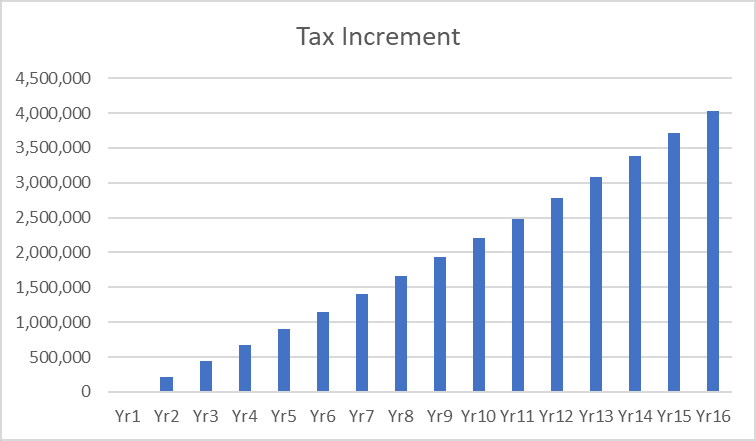
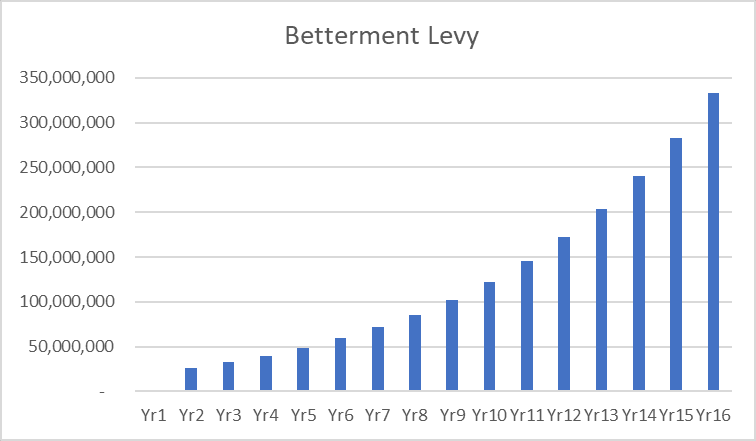 The base year MAV levy is $7.2 million; this becomes the fixed amount of annual revenue owed to regular taxing districts in all subsequent project years. The first year of diverting revenues to the URA yields $216,974 in tax increments after subtracting the base year levy. This compares rather unfavorably to a first year betterment levy of $26 million using the proposed TBD method. After 15 years of collecting tax increments the URA receives a sum of $30 million. As reported previously, the TBD collects a sum of $1,965 million. The TIF scheme captures only 1.5 percent of the amount captured from the difference in rapid and trend growth land rents using the TBD method (see Fig. 2).
The amount captured by TIF is much less primarily because of the effects of using lower MAV assessments at the base year and limiting the growth in assessments to 3 percent annually. Notice the annual betterment levy grows exponentially. This is because the lower trend rate compared to rapid rate produces the effect of accelerating betterment growth.
Simulation model results show the TBD method to be much more robust than TIF under the current circumstances imposed by M-50. The land rent capture rate for this TBD is 63 percent; the capture rate for TIF is less than one percent. The effect of this low capture rate is to leave in the hands of property owners almost all the capitalized gain in value that accrues from public actions as distinct from private investment. In effect, this is a windfall.
Figure 2
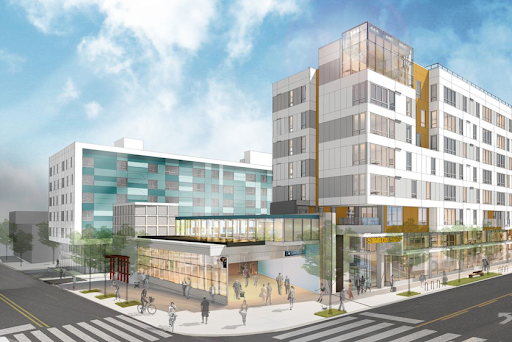
 It is obvious that the Capitol Hill – Broadway/E John St. station area is a high performing district. Not surprising given the evidence that residential price increase in Seattle’s north LINK corridor is higher than along rail lines in Chicago and Atlanta, and similar to those in Boston and D.C. By now the TOD area contains over 15 thousand housing units within a half-mile radius of the station. At this point it is not clear how strong the market is for implementing TOD in Portland’s Southwest Corridor. An analysis of land value uplift over the past five years could help form a reasonable estimate of the rapid growth rate. Selected MAX stops such as Barbur Transit Center with plans for a West Portland Town Center could offer promising prospects for a TBD pilot project. The Gibbs MAX stop with connections to South Waterfront is another prospect.
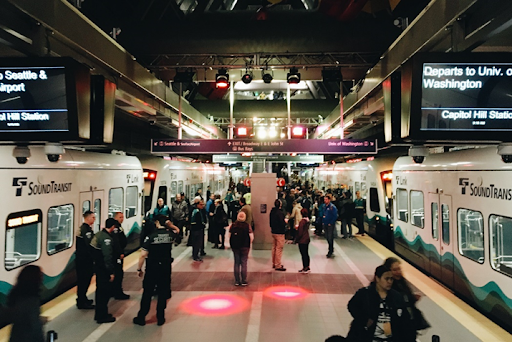
Capitol Hill Station, LINK Corridor, Seattle, WA
1 Comment
Pingbacks
-
[…] Institute a value capture mechanism such as Transit Benefit Districts a district circumscribing a transit station area designed to capture annual land value gains […]
[…] Institute a value capture mechanism such as Transit Benefit Districts a district circumscribing a transit station area designed to capture annual land value gains […]