Incentivizing Local Zoning Reforms with Land Value Taxation
By Tom Gihring
Common Ground – OR/WA
Working Paper
May 2021
Legalizing 2, 3 & 4 unit dwellings in single-family zones is a significant step in supporting affordable housing options; supplementing this reform with a land value tax can stimulate production.
_____________________________________
The Oregon Housing Economic Summit in January 2021 concluded that annual housing construction in Oregon needs to increase by over one-third over the next 20 years. No clear consensus emerged from the summit about how to close the gap. The Oregon Office of Economic Analysis maintains that local zoning policies opening single-family properties to moderate density housing will help boost supply, but not enough. Given the urgency of the housing affordability crisis, it’s up to the 2021 Legislature to tackle the problem, preferably through a market-driven approach employing economic incentives.
Land price inflation in recent years has far exceeded the pace of goods and services inflation. The supply and price of developable land is the major constraint on the ability of homebuilders to produce new homes. Portland’s recent amendment to the zoning code i allowing duplex, triplex and four-plex units in single-family zones is a significant step, potentially increasing the supply of developable sites. But the new rules do not provide the economic incentives to make the policy effective in increasing production of “missing middle housing”. The current land use planning system is not well equipped to induce housing affordability. We need to become more focused and intentional in the effort to incentivize development, especially on vacant and underutilized residential land.
There is an increasing recognition that using the tax system as an incentive tool can be an effective market-driven approach to increase housing production. Yet, Oregon’s property tax system as it remains 25 years after the tax revolt that resulted in Measure 5 and 50 limitations baked into the state constitution is too broken to offer any possibility for incentivizing development. The evidence is clear:
A 1999 study of tax effects in the Salem metropolitan area by Common Ground-OR/WA ii reveals disproportionately high tax burdens that accompany M-50 assessment limitations on central business district developed parcels, lower value locations, and residential properties in general. A 2013 study for the City Club of Portland iii concluded that Oregon’s property tax is inequitable, undermines local control, and fails to sustain service levels approved by voters. Property owners with similarly valued homes pay significantly different tax levies, an occurrence caused by the divergence of maximum assessed value (MAV) from real market value (RMV). MAVs are limited to a 3 percent increase annually, and by now lag far behind RMVs. “The ‘Frankentax’, is slowly but surely wreaking havoc upon communities, and requires a bold, comprehensive overhaul”.
A 2014 study of property tax capitalization by the Northwest Economic Research Center(NERC) at Portland State University for the League of Oregon Cities iv found that differences in tax payments are having a significant effect on sale price. Houses that have experienced large growth in value since the inception of the current system tend to be paying less as a percentage of their homes’ value in taxes, which is increasing sale price. This disproportionately benefits property owners who can afford to buy in areas with faster increases in property values. The NERC report focuses on Portland, but this same dynamic is likely at play in the rest of the state.
A follow-up study, also by NERC, conducted for Common Ground-OR/WA in 2019, confirmed the inequities caused by tax limitations that have accumulated over the past 22 years. v This study focuses on two contrasting communities in Portland: Inner Northeast (INE), a rapidly gentrifying residential and commercial district where MAV assessments (taxable under M-50 limitations) lag behind RMV; and Outer Southeast (OSE), a lower income, low property value community with MAV and RMV assessments in closer alignment.
Reaching further than the previous studies, this NERC study aimed at a solution to the problems of Oregon’s defective tax system. If rapidly rising land prices underly housing unaffordability, and if market incentives are needed to expand the range of re-developable sites, then a revised tax system based on land values offers the best answer. This is not a new concept. The idea of a land value tax (LVT) originated with 19th Century political economist Henry George. vi Several Pennsylvania cities have moved towards down-taxing building improvements and up-taxing land values. Research has verified the economic and social benefits of this conversion to LVT: land prices are dampened and speculation curtailed, putting more sites on the market; construction and rehabilitation increase, adding to housing supply and stabilizing rents. vii
No amount of government coercion through land use regulations or zoning policies will result in property owners doing what is not in their economic interest. The housing crisis will only ease when local governments take a larger share of its revenue from land values and a smaller share from capital investment in structures (improvement values).
Incentive Taxation to Stimulate Housing Production
The recent analysis by NERC concludes that the land-based property tax system is found to achieve what it is designed to do—shift more of the tax burden on wealthier landowners and encourage the highest and best use of land. An LVT would provide a more equitable tax structure, incentivize building upgrading and development of underutilized properties, and discourage land-holding for speculative purposes.
Using model simulations comparing conventional and LVT property tax applications on all parcels within the INE and OSE communities, the latest NERC study confirmed previous analyses examining the effects of LVT. Moving from the current tax system to an LVT shifts tax burden off higher density sites onto vacant and underutilized sites. For example, it was found that LVT incentivizes redevelopment in INE commercial corridors. In the NE Alberta Street corridor, conventional MAV tax levies on underutilized parcels are extremely low; changing to LVT would raise their tax bills significantly. But redeveloping the same sites to maximum zoned capacity changes the outcome. Average LVT levies on redeveloped commercial sites are now less, even less than the MAV levies which are higher because the current tax system does not lower the tax rate on improvement values.
Would the same levy inversion occur in the residential sector? In this working paper we expand on the NERC findings by examining more closely the LVT effects on single-family parcels. Specifically, we seek to validate the proposition that the incentive effects of LVT will underpin the Residential Improvement Project (RIP), the policy basis for the code amendments recently adopted by Portland city council allowing more housing type options.
If the number of households who want to live in a community increases, efficient and equitable development policies would allow densities to increase proportionately to accommodate that growth. Otherwise, wealthier households will outbid poorer households for a limited number of units, driving up prices and making housing an attractive investment for speculation.
Expanding housing options through reforms to the zoning code is a significant first step toward increasing the housing supply. This trend has been growing throughout North America, following the example of Minneapolis in December 2018. ix It is anticipated that the Sacramento city council will also allow small multi-unit housing such as duplexes, triplexes and fourplexes, because they’re more affordable than single family homes and less dense than large apartment buildings. x
Extensive academic research indicates that allowing more compact infill development tends to increase affordability. A new study of allowable densities in Portland found that both up-zoning and higher density zoning led to significantly greater development and more housing supply than in areas with lower allowable densities. xi Many of the newly allowable housing options will come from residential lots that are not developed to highest and best use, and others from vacant lots.
The Simulation Model
Using the parcel-level data set generated for the latest NERC study for tax year 2017-18, we extracted all Inner Northeast parcels classified by existing land use as single-family, even as some have been rezoned for multifamily or mixed use. Row houses are excluded. The data set numbers 7,780 developed and 182 vacant parcels. The first step in the analysis is to identify those parcels most likely to be redeveloped.
This requires criteria for classifying development status, using both valuation and site utilization measures. xii Three categories identified are (1) fully developed – parcels with a high improvement-to-land assessment ratio, and a high ratio of building floor space to lot area; (2) underutilized – parcels falling below the two thresholds; (3) vacant parcels. The last two categories are combined, resulting in two development status categories: fully developed, n=7,748; vacant & underutilized, n=327, see Table 1.
Next, we compute the zoned development capacity for all single-family parcels. The new RIP regulations allow up-zoning for missing middle housing options on parcels zoned for R5 and R2.5 only. The zoning code increases the allowable floor area ratio (FAR) and the minimum lot size in order to accommodate duplex, triplex, and fourplex buildings. For context we first include all single family parcels in the capacity analysis; some have been up-zoned since they were originally developed.
The allowable square footage of internal building floor area is calculated by multiplying the allowable FAR for each of eight zoning code categories by the lot area of each parcel. xiii Comparing this allowable capacity with existing floor area, we determine the unused capacity that could hypothetically be utilized to redevelop a parcel to a higher density as allowed in the zoning code, the total allowable capacity would determine the maximum building size. Model results are reported as parcel means.
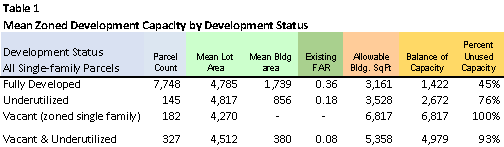
Allowable building FARs vary by zone, ranging from 0.5 in most single family zones to 3.0 in mixed-use and multifamily zones. The average existing FAR for all single-family parcels is 0.35, indicating some unused allowable capacity. The total balance of unused capacity is 12.6 million sq. ft. of building space; the average of all lots is 1,566 sq. ft.. Although almost half of the floor space potentially available on fully developed parcels is unused, most of that unused capacity comes from CM1, CM2 and CM3 zones, mixed use zones numbering 188 parcels. As expected the highest percentage of unused capacity is found on vacant and underutilized sites.
The next step is to determine the additional development capacity generated from the amended zoning code under RIP regulations. For this measure we shall use the term maximum capacity to distinguish from allowable capacity under the retiring zoning code. The new code allows up-zoning for missing middle housing options on parcels zoned for R5 and R2.5 only. Nearly 7,000 lots fall within these two zones.
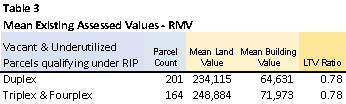
The amended RIP zoning code increases the allowable FARs and the minimum lot size to accommodate duplex, triplex, and fourplex buildings. xiv Eliminating parcels from the database that do not meet the minimum lot size threshold, 6,810 parcels now qualify for upgrades from single family units to duplexes; 6,492 qualify for 3 and 4 units. For all practical purposes most of these homes will remain as single-family units for the foreseeable future. For the purpose of modeling changes under the RIP amendments, we shall assume that redevelopment is limited to vacant and underutilized single-family parcels as determined by the criteria establishing development status: 201 qualifying for duplex conversions and 164 for triplex & four-plex conversions.
Redevelopment Scenarios
Now comparing the maximum capacity on re-developable parcels with existing building area, we determine the additional capacity that could hypothetically be utilized to redevelop a parcel to a higher density as allowed in the amended RIP zoning code.
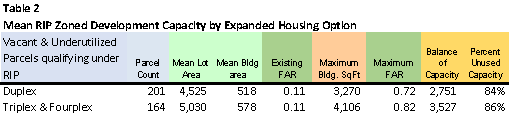
From Table 2 we see the mean existing building area on all the eligible lots is far below the maximum allowed under RIP regulations; the FARs are only 0.11 compared to the maximum FARs over .70. The maximum FAR is calculated by dividing the sum of maximum building areas on all qualifying parcels by the sum of the lot areas. If all the vacant & underutilized parcels were redeveloped to maximum capacity, the average total floor area on the 201 duplex qualified parcels would be 3,270 sq. ft., averaging 1,635 sq. ft. for each unit. For perspective on this, a typical lot zoned R5 is 5,000 sq. ft.; a maximum FAR of 0.6 yields a total building area of 3,000 sq. ft.. On the 164 triplex & fourplex qualified parcels the average total would be 4,106 sq. ft.xv , allowing for fourplex units of about 1,000 sq. ft. each.
The next step in the analysis is to determine assessed land and building values on qualifying parcels in both their existing and hypothetically redeveloped status. Table 3 shows the mean existing values. A good indication of the development status of the RIP eligible parcels is the land-to-improvement ratio (LTV ratio), previously used as the valuation criterion to determine each parcel’s status as either fully developed or underutilized. Recall that a high ratio (> .66) indicates most of the value comes from the land – indicative of a site less than its highest and best use.
It now remains to calculate real market values on the same sites redeveloped to RIP zoned capacity. Our preferred method is to simulate a reconstruction project by employing a development proforma. This is a routine method developers and investors use for feasibility analysis. It consists of a spreadsheet containing a set of calculations of costs and revenues, and results in a projection of the financial return that a proposed real estate development is likely to generate.
The proforma used here simply projects the total redevelopment value broken out by land and improvements for the average parcel. Input values include the existing physical site and value figures in Tables 2 and 3. The proforma contains separate projections for the two RIP housing types – duplex, and triplex & fourplex. The maximum FAR becomes the independent variable that projects the redeveloped building floor area. Input values under the heading of project development costs include unit costs for demolition, construction (hard & soft costs). xvi Output from the calculations includes the redeveloped building value; we assume the land value on an individual parcel remains the same as the existing value. The two values are combined for the total mean value of the redeveloped parcel.
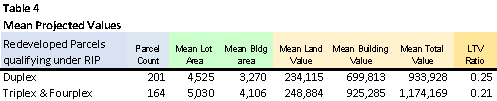
Mean building values on redeveloped sites are high enough to lower the LTV ratios considerably. These ratios (in the low 20s percent range) are found to be typical of new residential projects in the Portland area greater than single-family density. For comparison, the LTV ratio of all existing fully developed single-family parcels in INE is 0.46. Increasing building age tends to raise the ratio. These reduced LTV ratios on redeveloped sites are consequential in the subsequent modeling of property tax applications.
Tax Shift
The final step in the redevelopment scenario is to simulate property tax applications, comparing existing underutilized sites with the same sites redeveloped under the RIP amendment to the zoning code. Thus far we have obtained the RMV values for land & buildings. To complete the picture of tax shift under different property tax regimes we require figures for MAV assessments. From the developed parcel data base we obtain existing mean MAVs for the underutilized & vacant status subset. As a proxy for MAVs in the redeveloped category we shall assume that land values do not change at the time of reconstruction, therefore the mean MAVs remain the same. But there is a caveat. A closer look at the data indicates the need to increase the triplex & four-plex group mean MAV by 30 percent to reflect higher existing values on higher density sites. xvii
Tax rates for the levy code areas in the INE community are obtained from the NERC LVT study. xviii
Again, the purpose is to model tax levy results for the redevelopment scenario: RIP eligible parcels in their existing and redeveloped states. Comparisons are made across the different tax regimes: tax levies using MAVs, RMVs, a 60% LVT, and a 90% LVT. The land value tax method chosen for this analysis is a split-rate tax; the percentage figure expresses the proportion of the total tax rate applied to land assessments. All four tax rates are revenue neutral – resulting in the same Multnomah County-wide total levy amount. Individual parcel tax levies will vary depending on two factors: (i) the parcel’s MAV/RMV ratio (referenced above in the discussion comparing the two Portland study communities); (ii) the parcel’s LTV ratio showing the proportion of total assessment attributed to land value. Simulated tax levy outcomes are shown in Table 5 A&B.
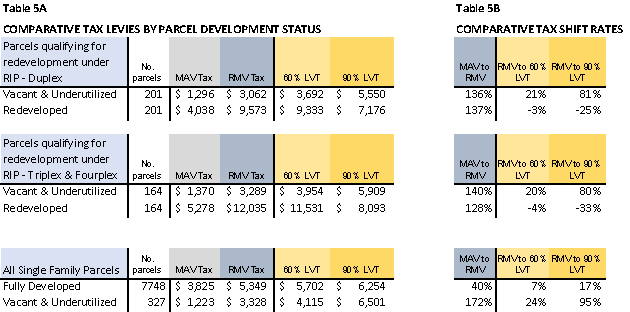
Moving through the tabular results it becomes clear that changing from the current tax system based on MAV assessments to an equal rate tax on RMV assessments, and on to the LVT system, tax levies become progressively higher on vacant & underutilized parcels. Note that LVT rates are based on RMV assessments, as it is important that in order to achieve the desired incentive effects assessments must be up-to-date and accurate, reflecting true market values. The effect of the split-rate land tax is to progressively lower tax levies when the same parcels are redeveloped. The 60% LVT would be employed during a phase-in period, so as not to cause economic dislocation or hardship to property owners that a sudden change to a 90% LVT could bring about.
The mean RMV tax levy is greater than the MAV levy because the 3 percent M-50 limitations on assessment growth since 1993 in this rapid growth community has resulted in a larger than normal departure from real market values. xix The MAV/RMV ratio of all properties in INE is 0.29, whereas the county-wide ratio is 0.39 – closer to true market value. As noted, the lower the MAV:RMV ratio, the greater the shift in tax levy when changing from the current tax system to a tax based on real market assessments.
As noted previously, the higher the LTV ratio, the greater the positive tax shift moving from an equal rate tax on RMV assessments to a differential rate tax based on RMV assessments. The county-wide LTV ratio (0.395) acts as a fulcrum in tax shift. The LTV ratio for vacant & underutilized parcels in the RIP qualified single-family data set being higher at 0.79 (see Table 3) elevates the land-based tax levies, and the ratio for redeveloped sites being about 0.23 (see Table 4) tips the tax levies downward. Basically, the LVT shifts tax burden from more efficiently utilized sites to less efficiently used sites.
Incentive Effects
With this outcome, we can now see the incentive effects of the land value tax. First, all existing single-family parcels in the INE community (from Table 1) are included in Table 5 to gain perspective on the effects of LVT. Here the RMV tax is raised under the LVT regime on parcels in both development status classes. This is explained by the fact that the LTV ratio for the whole single-family category in INE is high at 0.46 compared to the county-wide ratio of 0.395. Also, the percentage of increase when changing to RMV is much higher, as shown in Table 5, because the MAV/RMV ratio on all vacant lots in INE is only 0.17 or about 1/6th of true market value.
Proceeding to the RIP qualified parcels, we see the real incentive power of LVT. A change from the RMV tax to LVT raises the tax levy on vacant & underutilized parcels, especially when increasing the tax rate differential from 60 percent on land values to 90 percent. When redeveloped under RIP standards the rate of tax shift is now negative. The negative shift is greater on parcels converted to triplex & fourplex units because the density or land utilization level is higher. Figure 1 illustrates graphically the tax shift effects of converting the present tax system to a land value tax on the three housing types (left and bottom right).
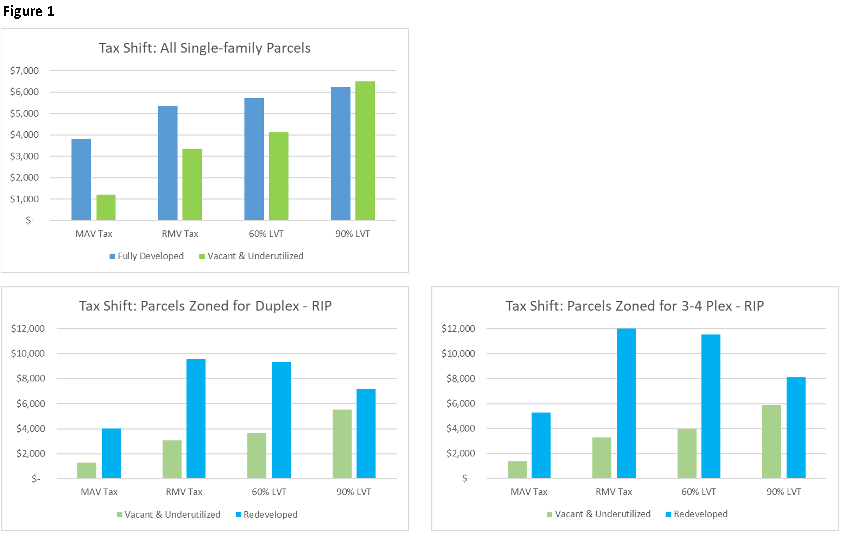
We adopt the progressive view that any tax reform in Oregon should first abandon MAV assessments to make the tax system more equitable. Starting our scenario with an equal rate tax on RMV assessments, we now see how adding a differential rate land value tax will incentivize the use of RIP zoning to increase housing production.
If vacant & underutilized parcels were left undeveloped, the average tax difference between a RMV tax and a 90% LVT on parcels qualifying for redevelopment under RIP zoning to a duplex is $2,488 more. If the same parcels were redeveloped, the tax difference is $2,397 less. The overall difference is $4,885 – the tax benefit of converting one parcel. The tax benefit for constructing a triplex or fourplex building is $6,562 (see also Figure 3). Because this is an annual tax levy it wouldn’t take long for owners to realize the tax penalty for leaving their lots in vacant, as well as the reward for investing in new buildings.
The Single-family Option
Now that we know the benefits of converting from vacant & underutilized to ‘missing middle’, is there an advantage of using this new RIP zoning feature rather than replacing these sites with single-family units instead? Portland city policy now aims to discourage demolition of smaller and older single-family homes and replacing them with large, luxury single-family dwellings. The RIP zoning amendment does not change allowable FARs but does limit the internal space to 2,500 sq. ft.. This effectively changes the potential building size of 58 percent of the vacant & underutilized single-family parcels in INE.
If this policy were not in effect the mean allowable building area would be as high as 5,358 sq. ft., as shown in Table 1, the allowable FAR at 1.19 (inclusive of all single-family parcels). Excluding multifamily and mixed-use zoned parcels, the allowable FAR comes down to 0.62. With the RIP rule change limiting building floor space the effective maximum FAR is further reduced to 0.48. No longer will single-family infills be built to reach 2,544 sq. ft. internal floor space, as would be allowed under the retiring code. The mean maximum is now 1,980 sq. ft.
We assume that only parcels that are zoned for single residential units will qualify for redevelopment for replacement, meaning it is most likely that owners of parcels originally developed as single-family homes and subsequently up-zoned for mixed use (MU) or multifamily (MF) residential use will take the higher use option. After eliminating vacant & underutilized parcels that exceed the 2,500 sq. ft. limit and zoned for MU and MF, the 234 parcels making up the subset are all zoned R2.5 or R5.
Again, using the proforma to project development costs for the single-family rebuild option, we insert the input variables from this eligible subset: (i) mean lot size is 4,126 sq. ft.; (ii) mean internal floor area is only 450 sq. ft.; land value is $210,980 and remains that after redevelopment; mean improvement value is $56,177. The maximum FAR at 0.48, results in an internal floor area of 1,980 sq. ft. on the average parcel. The mean building value after construction is $424,838; added to the land value the total value is $635,817. The LTV ratio on this typical site is 0.33, the same as the ratio found for new and recent single-family parcels in the INE data set zoned R2.5 and R5.
Moving on to the tax shift scenario, an illustration of tax shift on residential parcels redeveloped as single-family dwellings under the RIP code is found in Figure 2 below. Table 6 contains values. The incentive effect becomes clear: if left undeveloped, the 90% LVT raises the tax by 82 percent over the RMV equal rate tax to $4,996 ($2,258 more than the RMV tax). If the same parcels were redeveloped, the tax difference is calculated as column (4) less column (2), for a negative $577. The overall difference is $2,835 (combining $2,258 and negative $577) – the tax benefit of converting one parcel to a single-family dwelling.
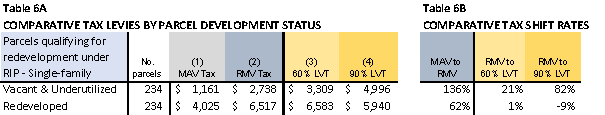
Figure 3 below shows the tax increase for leaving RIP eligible vacant & underutilized sites in their present status (above the X axis), and the tax reduction when redeveloping the same sites. The positive and negative tax shifts result from changing RMV taxation to 90% LVT. Combining the positive and negatives shows that a conversion to multiple units holds an advantage over the single family rebuild option.
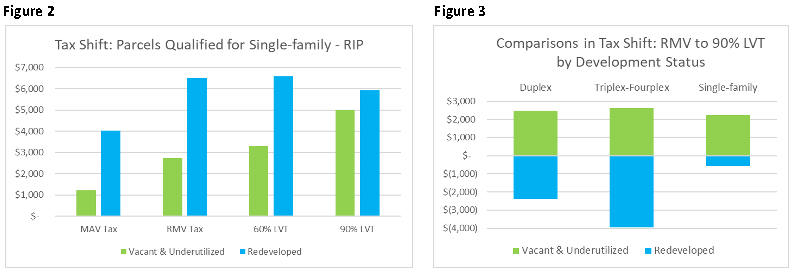
What is the exact marginal benefit of constructing multi-unit housing types over reconstructing a single-family dwelling? The overall $2,835 tax benefit for rebuilding as single-family is the reference point for comparison.
The marginal benefit for converting to a duplex rather than a single-family dwelling ($5,550 – $3,062 = $2,488, combined with $7,176 – $9,573 = minus $2,397, for an overall advantage of $4,885, less $2,835) is $2,050 in annual taxes (See Table 5A for the tax levy figures). For converting to a triplex or four-plex building the marginal benefit is $3,727.
These tax benefits are annual, and signal to the owner the consequences of either holding sites out of production over an extended period or converting sites to a higher density. Nevertheless, if an owner or an investor is seeking financial advantage or profit potential, he or she may consider determining the return on investment (ROI). The minimum acceptable rate of return (MARR) is defined as the ratio between the tax liability increase accompanying conversion and the increase in improvement value. xx An investment is a successful one if the actual ROI derived from a redevelopment proforma exceeds the minimum acceptable rate.
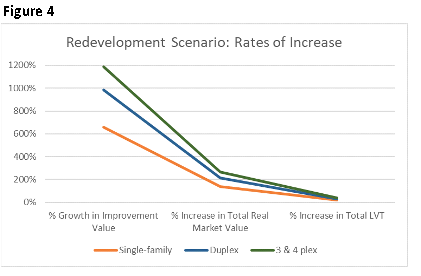 The MARR for all three development scenarios is only 0.26 percent, indicating that any ROI above this rate is a profitable investment. Figure 4 shows the rates of growth in improvement value, increase in total RMV, and increase in the 90 percent LVT. Converting to a 3–4 plex increases building value by nearly 1,200%, while increasing the LVT by 37% over the LVT levy acquired from its underutilized status. The duplex option increases the LVT by 29.3 percent. The evidence is unambiguous: leveraging a large increase in building size and value through redevelopment is worth the marginal LVT increase.
Conclusion
The evidence shown in these scenarios is conclusive: the land value tax does have the desired incentive effects that proponents claim.
Oregon’s fateful attempt to limit the growth of property taxes has resulted in gross inequities and adverse incentives that encourage holding land out of production and discourage capital investment in building improvements.
The Lincoln Institute for Land Policy established in 1974, xxi succinctly summarizes the best practices of a local property tax system. An efficient tax system raises revenue while minimizing unintended consequences, and an equitable tax system imposes obligations on taxpayers in proportion to their resources.
Property taxation is a fair, stable, and efficient source of local revenue.
Land value taxation is an economically efficient method of identifying the social contribution to property wealth.
Valuation methods are the key to appraising the property tax base accurately and distributing tax obligations fairly. Best practice assessments will build trust and stability to the property tax system and grow the economic base.
The City of Portland has taken another step toward expanding the supply of affordable housing by adopting the Residential Infill Project and subsequent zoning code amendments. It is now time to take the next step – to make our land use regulations work in in collaboration with incentive property taxation. The idea is catching on.
We’ll conclude with this statement from a new report offering a framework for local housing reforms:
“To expand the overall supply of housing, communities can relax zoning and other regulations, provide incentives for desired housing development, and shift the property tax to assess land at a higher rate than buildings, which encourages landowners to develop or sell vacant parcels.” xxii
NOTES:
1 The City of Portland adopted amendments to the zoning code that regulate the types of housing permitted in its neighborhoods. The
changes approved in July 2020 allow more housing options in the “missing middle” range, including duplexes, triplexes and fourplexes, if
they follow new limits on size and scale. The new zoning rules take effect in August 2021.
2 Tax Shift Sequential to a Land-Based Property Tax System in Salem, Oregon, Tom Gihring, Ph.D. and Kris Nelson, MBPA, Common
Ground – OR/WA, November 1999.
3 Reconstructing Oregon’s Frankentax: Improving the Equity, Financial Sustainability, and Efficiency of Property Taxes City Club of
Portland Bulletin, Vol. 95, No. 8, November 7, 2013.
4 Oregon Property Tax Capitalization: Evidence from Portland, Northwest Economic Research Center, College of Urban and Public
Affairs, Final Report, March 2014.
5 Land Value Tax Analysis: Simulating the Effects in Multnomah County, Northwest Economic Research Center, June 2019.
6 Henry George’s seminal work is the classic Progress and Poverty, first published by Appleton & Co. in 1880. He also wrote The Science
of Political Economy, copywrite 1897.
7 Tax Structure Analysis Report, Office of the City Controller, City of Philadelphia, Jonathan A. Saidel, City Controller, November 26, 2001.
The 238 Report: 238 Studies on the Impact of Land Value Taxation, by Steven B. Cord, Saving Communities, Pittsburgh, PA, n.d.
8 Residential Infill Project Summary – Draft, February 2019.
The Residential Infill Project (RIP) was developed by Portland’s Bureau of
Planning and Sustainabilty. The new policy recognized population growth pressures resulting in a housing shortage that has driven up
housing costs. Also, housing market changes have made it more attractive to construct large, expensive new houses in older residential
neighborhoods — even as the number of people per household is getting smaller. RIP sets a new standard: up to four homes on almost
any lot, or up to six homes for price-regulated projects.
See also:
Portland Just Passed the Best Low-Density Zoning Reform in U.S. History, Michael Andersen, Sightline Institute, August 11, 2020.
9 Will Banning Single-Family Zoning Make for More Affordable Homes? Deonna Anderson, in YES! Journalism for People Building a
Better World, posted July 31, 2019.
Smart Growth C'est Bon! Compact infill development can create affordable, inclusive and attractive cities, like Montreal, "plus belle
ville au monde." Todd Litman in Planetizen, BLOG POST, December 31, 2020. Montreal allows multifamily housing on 54% of its
residential land, about twice as much as comparable Canadian cities. As a result of these flexible development policies, central Montreal
neighborhoods are full of missing middle housing types, townhouses and low-rise apartment building, which creates an abundant,
competitive market for inexpensive homes.
10 Sacramento Could be One of First Cities to Reform Single-Family Home Zoning. Here’s How it Would Work, Chris Nichols in CAPRADIO,
February 15, 2021. A local proposal is moving forward that would make the city of Sacramento one of the first in California and the nation
to eliminate rules that allow only for single family homes in neighborhoods, allowing developers to build small apartment buildings,
duplexes and triplexes in neighborhoods zoned almost exclusively for single family homes.
11 Cities Start to Question an American Ideal: A House with a Yard on Every Lot, Emily Badger and Quoctrung Bui, in The Upshot, June 18,
2019.
Exploring the Impacts of Zoning and Up-zoning on Housing Development: A Quasi-experimental Analysis at the Parcel Level, Hongwei
Dong, Journal of Planning Education and Research, 20 May 2021), Cited in: Affordable-Accessible Housing in a Dynamic City: Why and
How to Increase Affordable Housing in Accessible Neighborhoods, Todd Litman, Victoria Transport Policy Institute, 16 March 2021.
12 Note: Two criteria combined are used to determine the development status of a parcel:
1. The ratio of land assessment to total assessed valuation (in RMVs), expressed as the LTV ratio. The threshold ratio is less than .66
for the fully developed status category. (More than half the assessed value is in building improvements) Conversely, if the LVT
exceeds .66, a parcel is underutilized (more than half the assessed value is in land), or vacant if so designated.
2. The floor area ratio (FAR) is a standard measure derived from the building area (floor space in square feet) as a percentage of lot
area. A standard FAR is derived from the mean FAR of all newer single-family structures (1010 to 2017-18) in each zone from the
zoning code. The threshold is set at 50% of the standard FAR. A parcel is considered fully utilized if the parcel’s FAR is greater than
the standard FAR for the zone in which the subject parcel is located; it is considered underutilized if its FAR is below the threshold.
Summarized: Underutilized = LTV ratio > .66 and FAR < 50% of standard FAR
Fully developed = LTV ratio <.66 and FAR > 50% of standard FAR
13 Note: Criteria to determine zoned development capacity using allowable FARs for all single-family & mixed used zones is found in Chap
33.130, Table 130-2 of the city’s zoning code.
Allowable FARs for the zones present in INE: R2.5 = 0.7 R5 = 0.5 CM2 = 2.5
CM3 = 3.0 R1 = 1.0 (est.) R2 = 0.9 (est.) CM1 = 1.5 RH = 0.7 (est.)
In three zones allowable capacity is not expressed in FAR terms; therefore we substitute average FARs found on parcels with new
residential buildings in those zones.
14 Residential Improvement Project Zoning Code Amendments, July 2020
Chapter 33.110.265.D
Duplexes: In R5 zones maximum FAR = 0.6, new minimum lot area = 3,000 sf.
In R2.5 zones maximum FAR = 0.8, new minimum lot area = 1,600 sf.
Chapter 33.110.265.E.
Triplex & Fourplexes: In R5 zones maximum. FAR = 0.7, new minimum lot area = 3,150 sf.
In R2.5 zones maximum FAR = 0.9, new minimum lot area = 2,880 sf.
15 The mean building size of 4,106 sq. ft. exceeds the new RIP maximum of 3,500 sq. ft. for 3 & 4 plex redevelopments. The maximum FAR
applied to a few especially large lots drives up the average. We assume that these cases will fall into the RIP category of six-unit housing
types subject to affordability restrictions. Being few in number, they are not differentiated in the analysis or summary tables.
16 Proforma input figures: Hard costs Soft costs
Small infill $185 15% Use for duplex
Town house $195 15% Use for triplex & fourplex
Soft costs as a percentage of hard costs include design, engineering, inspection fees, insurance, accounting & legal fees, construction loan
fees & interest payments.
These figures are based on Technical Memorandum, Community Attributes Inc., Nov 29, 2016. Estimated Construction Costs, MHA
Economic Analysis, 2016
(The NERC method of projecting building construction costs is to increase the existing land value by a factor of three. We found this
method to come close to our proforma method on the duplex scenario but falling short on the triplex & fourplex configurations. The
assumption that land value remains unchanged is consistent with that of the NERC analysts using the same data set.)
17 This assumption, MAVs remaining unchanged, is consistent with the methodology used by NERC analysts in their latest report. This is
verified by the finding that on developed lots the MAVs for duplex and single-family housing types are found to be similar. But the data
show that row house properties (less than five units) have about a 30% higher average MAV than single-family structures.
Mean MAVs
All Single-family parcels: Vacant & Underutilized = 48,819 Fully developed = 152,863
RIP parcels – Duplex: Vacant & Underutilized = 51,825 Redeveloped = 161,464
RIP parcels – 3 & 4 plex: Vacant & Underutilized = 54,778 Redeveloped = 211,044
18 Multnomah County TAX RATES, expressed as mill rates ($ per 1000 AV):
MAV = 25.01 RMV = 10.25 60% LVT LAND = 13.32 60% LVT IMPROVEMENTS = 8.88
90% LVT LAND = 23.00 90% LVT IMPROV = 2.56
Note the RMV rate is lower that the MAV rate because market rate assessments are higher. The tax rate must be lowered to achieve
revenue neutrality. Effective LVT rates are derived from a conversion formula.
19 MAV:RMV ratios, INE community
Status Category Ratio: MAV RMV
Fully Developed 0.29
Underutilized 0.18
Vacant (zoned single family) 0.13
Vacant & Underutilized 0.15
20 We utilize the methodology for redevelopment scenarios in the NERC LVT report. ROI tries to directly measure the amount of return
on a particular investment, relative to the investment’s cost. The result is expressed as a percentage or a ratio, calculated by taking the
difference between the current value of the investment and the cost of the investment, and dividing that value by the cost of the
investment. The higher the ratio, the better the ROI. An investment is a successful one if the actual rate of return is above the minimum
acceptable rate of return (MARR).
21 Lincoln Institute of Land Policy was established in 1974 in Cambridge, Mass. as a center for education on land use and land-related tax
issues. Its work is focused on urban planning and smart growth policies, land economics, property evaluation, land reform and property
rights.
22 Through the Roof: What Communities Can Do About the High Cost of Rental Housing in America, Ingrid Gould Ellen, Jeffrey Lubell,
and Mark A. Willis, March 2021, a Lincoln Institute of Land Policy publication.
2 Comments
Pingbacks
-
[…] The working paper, Incentivizing Local Zoning Reforms with Land Value Taxation, with associated methodology can be found here. […]
-
[…] a financial cost on their exclusionary rent-seeking, dulling their NIMBY urges and even helping turn them into YIMBYs. By removing land’s role as the central pathway to retirement-saving for households, […]
[…] The working paper, Incentivizing Local Zoning Reforms with Land Value Taxation, with associated methodology can be found here. […]
[…] a financial cost on their exclusionary rent-seeking, dulling their NIMBY urges and even helping turn them into YIMBYs. By removing land’s role as the central pathway to retirement-saving for households, […]